The population of a formerly endangered mouse is now on the rise. The population, N, over the last 8 years can be represented with the following graph: 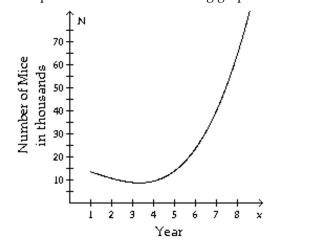 When was the mice population the lowest?
A) Just after the end of the third year.
B) At the beginning of the 8 year period.
C) Just before the end of the second year.
D) During the fifth year.
Correct Answer:
Verified
Q94: The population of rabbits varies with the
Q95: Crafty Bill's Cool Car Sales opened as
Q96: A box is to be made
Q97: The following graph shows the stock price
Q98: The following graph shows the stock price
Q100: This chart shows the fees for
Q101: Graph the function with a graphing
Q102: Provide an appropriate response.
-If the ordered
Q103: Graph the function with a graphing
Q104: Graph the function with a graphing
Unlock this Answer For Free Now!
View this answer and more for free by performing one of the following actions

Scan the QR code to install the App and get 2 free unlocks

Unlock quizzes for free by uploading documents