Suppose that the speed of a car, measured in miles per hour (mph) , is monitored for some short period of time after the driver applies the brakes. The following table and graph relate the speed of the car to the amount of
Time, measured in seconds (sec) , elapsed from the moment that the brakes are applied. 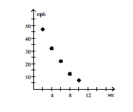 What general trend do the data reflect? In which of the time intervals does the speed change the most?
A) With increasing elapsed time, the speed decreases. The speed changes most during the time interval from 8 seconds to 10 seconds.
B) With increasing elapsed time, the speed decreases. The speed changes most during the time interval from 2 seconds to 4 seconds.
C) With increasing elapsed time, the speed increases. The speed changes most during the time interval from 2 seconds to 4 seconds.
D) With increasing elapsed time, the speed increases. The speed changes most during the time interval from 8 seconds to 10 seconds.
Correct Answer:
Verified
Q84: This chart shows the fees for
Q85: This chart shows the fees for
Q86: The number N, in millions of Americans
Q87: This chart shows the number of
Q88: A store takes inventory of a
Q90: This chart shows the number of
Q91: The number of births in a certain
Q92: This chart shows the number of
Q93: The population of rabbits varies with the
Q94: The population of rabbits varies with the
Unlock this Answer For Free Now!
View this answer and more for free by performing one of the following actions

Scan the QR code to install the App and get 2 free unlocks

Unlock quizzes for free by uploading documents