Solve the problem.
-The bar graph below shows a company's yearly profits from 2003 to 2011. Let an represent the company's profit, in millions, in year n, where n = 1 corresponds to 2003, n = 2 corresponds to 2004, and so on. 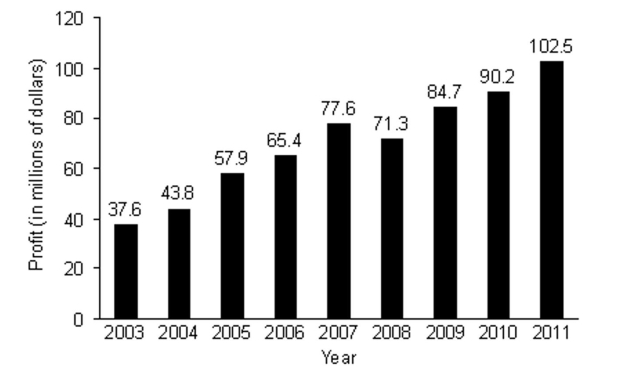
A) $505.8 million
B) $549.6 million
C) $167.9 million
D) $491.7 million
Correct Answer:
Verified
Q47: Solve the problem.
-The finite sequence whose
Q48: Write the first five terms of
Q49: Write the first five terms of the
Q50: Express the sum using summation notation.
Q51: Find the common difference for the arithmetic
Q53: Write the first five terms of the
Q54: Write the first five terms of the
Q55: Express the sum using summation notation.
Q56: Find the common difference for the arithmetic
Q57: Express the sum using summation notation.
Unlock this Answer For Free Now!
View this answer and more for free by performing one of the following actions

Scan the QR code to install the App and get 2 free unlocks

Unlock quizzes for free by uploading documents