The pie chart below shows the number of pizzas consumed by college students in a typical month. Use the chart to
answer the question. 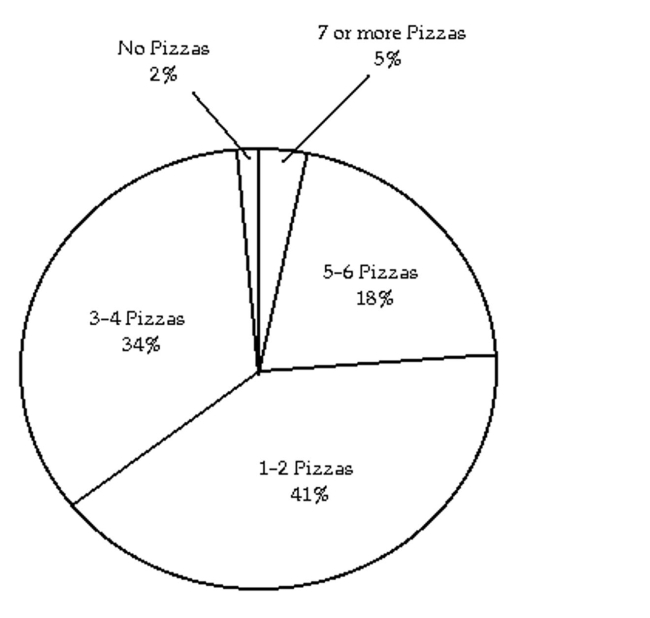
-What percent of college students consume 3 or more pizzas in a typical month?
A) 52%
B) 57%
C) 34%
D) 98%
Correct Answer:
Verified
Q141: Solve the problem.
-If 5 is increased to
Q142: Let x represent the number. Write the
Q143: Let x represent the number. Write the
Q144: Let x represent the number. Write
Q145: Solve the problem.
-If 100 is decreased to
Q147: Let x represent the number. Use
Q148: Let x represent the number. Write the
Q149: Let x represent the number. Use the
Q150: Let x represent the number. Write the
Q151: Let x represent the number. Use
Unlock this Answer For Free Now!
View this answer and more for free by performing one of the following actions

Scan the QR code to install the App and get 2 free unlocks

Unlock quizzes for free by uploading documents