Graph the equation. Find seven solutions in your table of values for the equation by using integers for x, starting with -3
and ending with 3.
-A census was taken to determine the median annual income for residents of a selected region of the United States, by level of education. The given polynomial models describe the median annual income for men, M, and
For women, W, who have completed x years of education. Shown in a rectangular coordinate system are the
Graphs of the polynomial models. Identify the median annual income for a man with 10 years of education as a
Point on the appropriate graph. 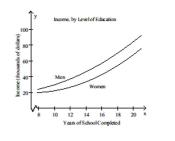
A) (10, 41,240)
B) (10, 58,431)
C) (10, 29,846)
D) (10, 22,161)
Correct Answer:
Verified
Q41: Multiply the monomials. Q42: Graph the equation. Find seven solutions Q43: Simplify the expression using the products-to-powers Q44: Multiply the expression using the product Q45: Multiply the expression using the product Q47: Multiply the expression using the product Q48: Simplify the expression using the products-to-powers Q49: Simplify the expression using the power Q50: Perform the indicated operations. Q51: Multiply the monomials.
-
-The bar graph
-
Unlock this Answer For Free Now!
View this answer and more for free by performing one of the following actions

Scan the QR code to install the App and get 2 free unlocks

Unlock quizzes for free by uploading documents