The graph below shows the percentage of students enrolled in the College of Engineering at State University. Use the graph to
answer the question. 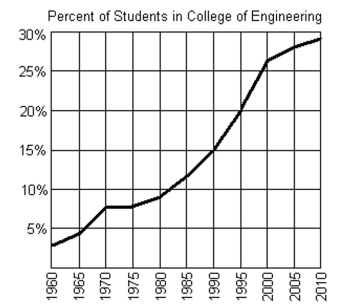
-Between what two years is the difference in function values equal to 5%?
A) between 1995 and 2000
B) between 1990 and 1995
C) between 1980 and 1985
D) between 1970 and 1975
Correct Answer:
Verified
Q51: Use the graph to find the indicated
Q52: Express the interval in set builder
Q53: Use the vertical line test to determine
Q54: Use the vertical line test to determine
Q57: Use the graph to find the indicated
Q58: Express the interval in set builder
Q59: Express the interval in set builder
Q60: Use the vertical line test to determine
Q61: Find the indicated function value.
-
Q80: The graph below shows the percentage
Unlock this Answer For Free Now!
View this answer and more for free by performing one of the following actions

Scan the QR code to install the App and get 2 free unlocks

Unlock quizzes for free by uploading documents