Solve the problem using inductive reasoning.
-The following graph shows the average monthly cost for satellite television for each year from 2005 through 2012. Assuming the trend continues, use the graph to predict the average monthly Cost for satellite TV in 2013. 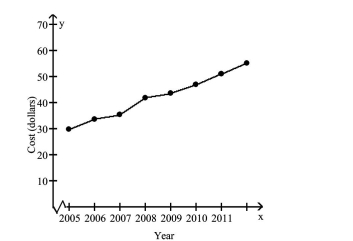
A) $42
B) $68
C) $48
D) $58
Correct Answer:
Verified
Q29: In how many ways can you exactly
Q30: How many rectangles are there in the
Q31: How many rectangles are there in the
Q32: Find the number of games played
Q33: How many line segments are determined by
Q35: Solve the problem.
-Estimate the answer by rounding
Q36: Solve the problem using inductive reasoning.
-How many
Q37: Solve the problem.
-Estimate the answer by rounding
Q38: Solve the problem.
-Estimate the answer by rounding
Q39: Solve the problem.
-Estimate the answer by rounding
Unlock this Answer For Free Now!
View this answer and more for free by performing one of the following actions

Scan the QR code to install the App and get 2 free unlocks

Unlock quizzes for free by uploading documents