Use the circle graph to answer the question.
-Average Daily Numbers of Livestock (in thousands) - Category A Farms, 2002 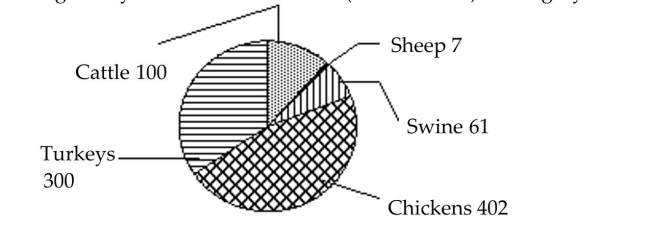
What percent of livestock was chickens? Round to the nearest tenth of a percent.
A) 462.1% chickens
B) 49.7% chickens
C) 37.0% chickens
D) 46.2% chickens
Correct Answer:
Verified
Q6: Write as a percent.
-
Q7: Use the circle graph to answer the
Q8: Write as a percent.
-0.5
A) 0.05%
B) 500%
C) 0.5%
D)
Q9: Write as a decimal.
-
Q10: Use the circle graph to answer the
Q12: Write as a decimal.
-95.8%
A) 0.848
B) 0.958
C) 0.0958
D)
Q13: Write as a decimal.
-77%
A) 0.66
B) 0.77
C) 0.077
D)
Q14: Write as a percent.
-9.1
A) 0.91%
B) 910%
C) 0.0091%
D)
Q15: Write as a percent.
-0.078
A) 78%
B) 0.0078%
C) 7.8%
D)
Q16: Write as a decimal.
-84.83%
A) 0.8383
B) 0.08483
C) 8.483
D)
Unlock this Answer For Free Now!
View this answer and more for free by performing one of the following actions

Scan the QR code to install the App and get 2 free unlocks

Unlock quizzes for free by uploading documents