Solve the problem.
-Use the following graph which shows the number of customer service calls to a major appliance Manufacturer, in millions, for the years 2006-2012. Use the graph to represent the set in roster Form. 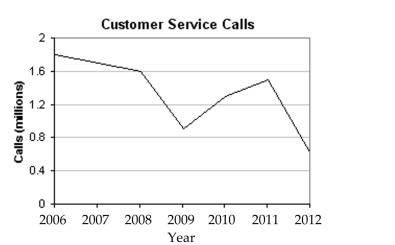
The set of years in which the number of customer service calls exceeded 1.1 million.
A) {2009, 2012}
B) {2006, 2007, 2008, 2010, 2011}
C) {2006, 2007, 2008, 2009, 2010, 2011}
D) {2006, 2007, 2008, 2011}
Correct Answer:
Verified
Q22: Express the set in roster form.
-{x|x is
Q23: Solve the problem.
-Use the following graph, which
Q24: Write the set in set-builder notation.
-{7}
Q25: Solve the problem.
-Use the following table,
Q26: Solve the problem.
-Use the following table,
Q28: Express the set in roster form.
-{x|x is
Q29: Express the set in roster form.
-The set
Q30: Express the set in roster form.
-The set
Q31: Solve the problem.
-Use the following table,
Q32: Express the set in roster form.
-{x|x is
Unlock this Answer For Free Now!
View this answer and more for free by performing one of the following actions

Scan the QR code to install the App and get 2 free unlocks

Unlock quizzes for free by uploading documents