Produce a rule for the function whose graph is shown.
-A math tutor makes $15.00 per hour in the tutoring lab at her school. During final exam week, she earns overtime at $22.50 per hour for the work exceeding her normal 40-hr work week. Which
Graph best depicts her total salary for the week as a function of the number of hours worked?
A) 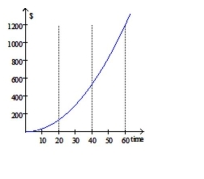
B) 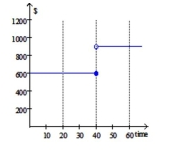
C) 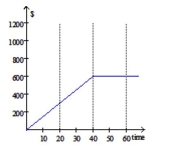
D) 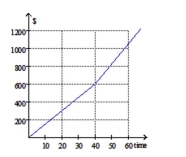
Correct Answer:
Verified
Q324: Use interval notation to write the
Q325: Write the word or phrase that best
Q326: Use interval notation to write the
Q327: Use the given information to
a. Graph
Q328: Evaluate the function for the given
Q330: Evaluate the function for the given
Q331: Choose the one alternative that best
Q332: Identify the location and value of
Q333: Write the word or phrase that
Q334: Choose the one alternative that best
Unlock this Answer For Free Now!
View this answer and more for free by performing one of the following actions

Scan the QR code to install the App and get 2 free unlocks

Unlock quizzes for free by uploading documents