Solve the problem.
-The graph shows the number of organ transplants in a certain country for the years 2005 to 2010 where represents the number of years since 2005 .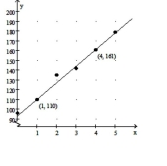
The linear model was created using the points and .
a. Interpret the meaning of the slope in the context of this problem.
b. Interpret the meaning of the -intercept in the context of this problem.
A) a. means that more organ transplants were performed in 2009 than in 2006 .
b. The -intercept is and means that health officials predicted that
approximately 96 organ transplants would be performed in the year 2005 .
B) a. means that the number of organ transplants increased at an average rate of per yr during this time period.
b. The -intercept is and means that approximately 93 organ transplants were performed in the year 2005 .
C) a. means that the number of organ transplants increased at an average rate of per yr during this time period.
b. The -intercept is and means that approximately 96 organ transplants were performed in the year
D) a. means that more organ transplants were performed in 2009 than in 2006 .
b. The -intercept is and means that health officials predicted that approximately 93 organ transplants would be performed in the year
Correct Answer:
Verified
Q220: The slope of a line is
Q221: Use the scatter plot to determine if
Q222: Solve the problem.
-A certain medicine is administered
Q223: Write an equation of the line
Q224: Solve the problem.
-At the Jumping Jack
Q226: Solve the problem.
-In 2005, a special mixed-nut
Q227: Write an equation of the line satisfying
Q228: Solve the problem.
-Joey borrows $2,400 from his
Q229: Compute the least-squares regression line for
Q230: Solve the problem.
-The graph shows the
Unlock this Answer For Free Now!
View this answer and more for free by performing one of the following actions

Scan the QR code to install the App and get 2 free unlocks

Unlock quizzes for free by uploading documents