Solve the problem.
-The points shown in the graph represent the per capita consumption of chicken and beef in a country x years after the year 2000. Yearly Per Capita Consumption of Chicken and Beef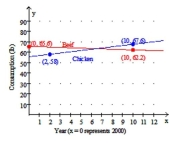
a. Use the given data points to write a linear function that approximates per capita consumption of Chicken C(x) (in lb) at a time x years since the year 2000.
b. Use the given data points to write a linear function that approximates per capita consumption of Beef B(x) (in lb) at a time x years since the year 2000.
c. Approximate the solution to the system of linear equations defined by the functions from parts (a)
And (b) . Round to 1 decimal place. Interpret the meaning of the solution to the system.
A) a.
b.
c. Midyear in 2,006 , the per capita consumption of beef and chicken was approximately equal at each
B) a. ;
b.
c. Midyear in 2,006 , the per capita consumption of beef and chicken was approximately equal at each
C) a.
b.
c. Midyear in 2,007 , the per capita consumption of beef and chicken was approximately equal at each
D) a. ;
b.
c. Midyear in 2,007 , the per capita consumption of beef and chicken was approximately equal at each
Correct Answer:
Verified
Q50: Write the word or phrase that best
Q51: Solve the problem.
-A vendor at a
Q52: Solve the system by substitution.
-9x - 5y
Q53: Solve the problem.
-Given
Q54: Solve the problem.
-A helicopter flies 168 miles
Q56: Write the word or phrase that best
Q57: Solve the problem.
-Abram and Fred leave opposite
Q58: Write the word or phrase that best
Q59: Solve the problem.
-One angle measures 27° more
Q60: Choose the one alternative that best
Unlock this Answer For Free Now!
View this answer and more for free by performing one of the following actions

Scan the QR code to install the App and get 2 free unlocks

Unlock quizzes for free by uploading documents