The following scatterplot shows the percentage of the vote a candidate received in the 2004_ senatorial elections according to the voter's income level based on an exit poll of voters
Conducted by CNN. The income levels 1 -8 correspond to the following income classes:
1 =Under $15,000; 2 =$15-30,000; 3=$30-50,000; 4=$50-75,000; 5=$75-100,000; 6=$100-
150,000; 7=$150-200,000; 8=$200,000 or more. 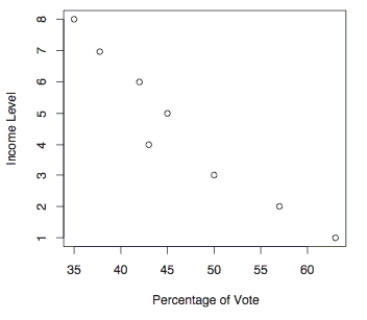 Use the election scatterplot to determine whether there is a correlation bet ween percentage of
Vote and income level at the 0.01 significance level with a null hypothesis of ρs = 0.
A) The test statistic is between the critical values, so we fail to reject the null hypothesis. There is no evidence to support a claim of correlation between percentage of vote and
Income level.
B) The test statistic is not between the critical values, so we fail to reject the null hypothesis. There is no evidence to support a claim of correlation between percentage of
Vote and income level.
C) The test statistic is between the critical values, so we reject the null hypothesis. There is sufficient evidence to support a claim of correlation between percentage of vote and
Income level.
D) The test statistic is not between the critical values, so we reject the null hypothesis. There is sufficient evidence to support a claim of correlation between percentage of vote
And income level.
Correct Answer:
Verified
Q2: Describe the rank correlation test. What types
Q18: Give at least two examples of nonparametric
Q26: When applying the runs test for randomness
Q27: Describe the runs test for randomness. What
Q28: Use the sign test to test the
Q31: If test A has an efficiency rating
Q76: Use the Wilcoxon rank-sum test to
Q78: Use the sign test to test
Q80: Use a Kruskal-Wallis test to test
Q85: Use the Wilcoxon signed -ranks test
Unlock this Answer For Free Now!
View this answer and more for free by performing one of the following actions

Scan the QR code to install the App and get 2 free unlocks

Unlock quizzes for free by uploading documents