Examine the given run chart or control chart and determine whether the process is within statistical control. 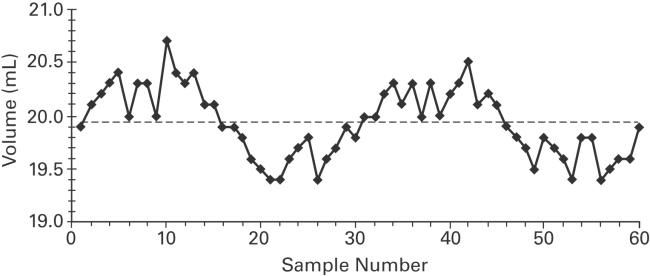
A) The process is within statistical control.
B) The process is not within statistical control.
Correct Answer:
Verified
Q3: List the advantages and disadvantages of nonparametric
Q46: Which graph using individual data values
Q47: Examine the given run chart or control
Q49: The centerline for a control chart for
Q50: Examine the given run chart or control
Q51: Examine the given run chart or control
Q52: Which type of chart would be
Q54: Use the given process data to
Q57: R charts are used to monitor_.
A) means
B)
Q58: Control charts are used to monitor changing
Unlock this Answer For Free Now!
View this answer and more for free by performing one of the following actions

Scan the QR code to install the App and get 2 free unlocks

Unlock quizzes for free by uploading documents