Examine the given run chart or control chart and determine whether the process is
within statistical control. If it is not, identify which of the three out-of-statistical-control
criteria apply. 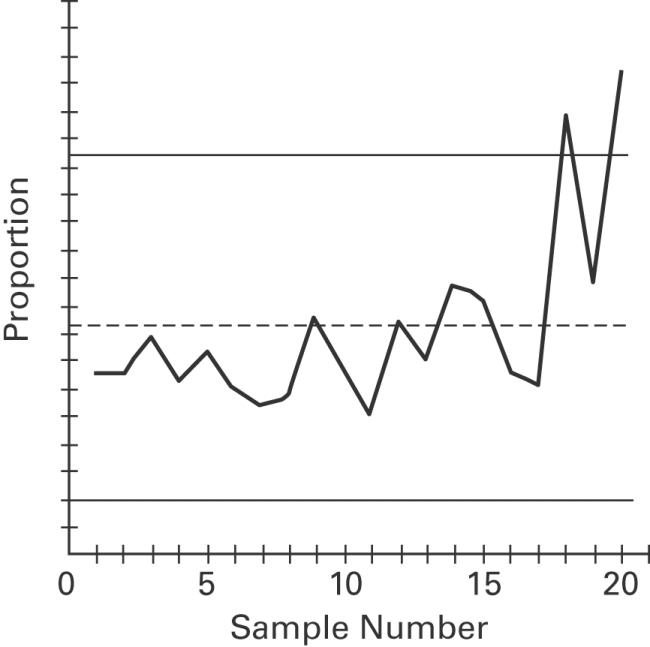
Correct Answer:
Verified
View Answer
Unlock this answer now
Get Access to more Verified Answers free of charge
Q6: Define statistically stable (or "within statistical control").
Q32: Describe a p chart and give an
Q34: A control chart for
Q36: A run chart for individual values is
Q38: A control chart for
Q40: Consider process data consisting of the
Q42: Use the given process data to
Q43: _ measurement of a characteristic or good
Q46: _ variation results from causes that can
Q57: R charts are used to monitor_.
A) means
B)
Unlock this Answer For Free Now!
View this answer and more for free by performing one of the following actions

Scan the QR code to install the App and get 2 free unlocks

Unlock quizzes for free by uploading documents