Examine the given run chart or control chart and determine whether the process is within
statistical control. If it is not, identity which of the three out-of-statistical-control criteria
apply. A run chart for individual values W is shown below. Does there appear to be a pattern
suggesting that the process is not within statistical control? If so, describe the pattern. 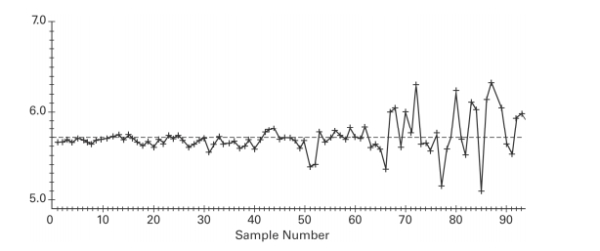
Correct Answer:
Verified
View Answer
Unlock this answer now
Get Access to more Verified Answers free of charge
Q2: A common goal of quality control is
Q6: Define statistically stable (or "within statistical control").
Q12: Describe an R chart and give an
Q13: A control chart for
Q13: Provide an appropriate response. Describe what process
Q15: Use the given process data to
Q16: Construct a run chart for individual
Q20: Use the given process data to
Q21: Construct an R chart and determine
Q22: Examine the given run chart or control
Unlock this Answer For Free Now!
View this answer and more for free by performing one of the following actions

Scan the QR code to install the App and get 2 free unlocks

Unlock quizzes for free by uploading documents