Use the following display for the next questions. The display is based on
sample annual data relating to the ozone layer monitoring at Halley Station in
Antarctica. The dependent variable is the year. The independent variables are as
follows: the level of ozone in Dobson units (DU), the global temperature (Temp, in
°C ), and the United States chlorofluorocarbon (CFC) gases production (in
thousands of metric tons).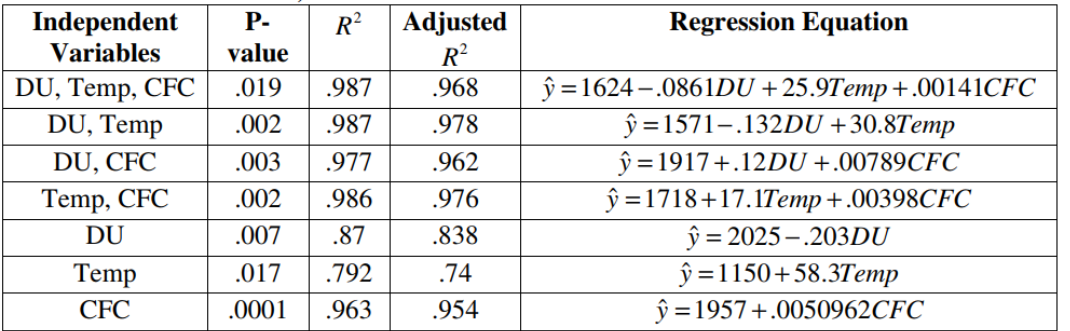
-Identify the P-value corresponding to the overall significance of the multiple regression equation that expresses the year in terms of global temperature and US production of CFCs.
Correct Answer:
Verified
Q9: Use the following display for the next
Q10: Use the following display for the next
Q11: Use the following display for the next
Q12: Use the following display for the next
Q13: For the next questions, identify the choice
Q13: For the next questions, identify the choice
Q15: Use the following display for the next
Q16: For the next questions, identify the choice
Q17: For the next questions, identify the choice
Q18: Use the following display for the next
Unlock this Answer For Free Now!
View this answer and more for free by performing one of the following actions

Scan the QR code to install the App and get 2 free unlocks

Unlock quizzes for free by uploading documents