The figure represents the results of a survey on favorite foods. 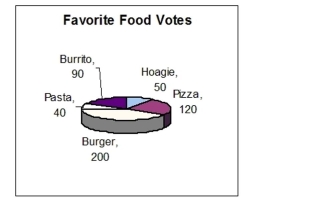 What is the total number of votes represented in this graph?
A) 500 votes
B) 550 votes
C) 400 votes
D) 450 votes
Correct Answer:
Verified
Q103: Which number is closer to 1 on
Q104: Multiply. Q105: In a recent survey 38% of the Q106: Simplify. 42 ÷ 3 ÷ 2 Q107: An inheritance of $20,223 is to be Q109: Simplify using the order of operations. 54 Q110: Find the area of the shaded region. Q111: Solve the percent problem for the unknown Q112: Fill in the blank with < or Q113: Find ![]()
A)7
B)9
C)10
D)8![]()
Unlock this Answer For Free Now!
View this answer and more for free by performing one of the following actions

Scan the QR code to install the App and get 2 free unlocks

Unlock quizzes for free by uploading documents