The following table shows the U.S. population for the years 1920-2000. 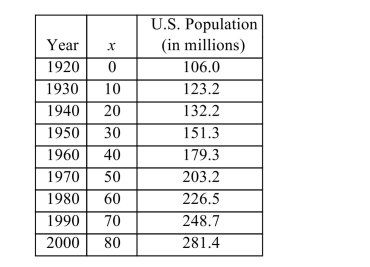
a. Determine whether the equation of best fit for this data will be quadratic or exponential, and find the equation of the best fit. Round coefficients to 4 decimal places.
b. What is the y-intercept and what does it represent?
c. Would an x-intercept make sense in this case? If so, find it. If not, explain why not.
d. At approximately what rate is the U.S. population growing?
e. Use the equation to estimate the U.S. population in 2013. Round to the nearest tenth of a million.
f. Using the equation, when will the U.S. population break 400 million?
Correct Answer:
Verified
Q146: Q147: Heartbreak Hill is a hill on the Q148: In 2000, the population of Sheboygan, WI Q149: Factor completely. Q150: If a person takes a 40 mg Q151: Simplify. Write your answer in exponent form. Q152: Q153: Subtract the polynomials. Q154: The average number of words that can Q156: Of all the topics we have covered Unlock this Answer For Free Now! View this answer and more for free by performing one of the following actions Scan the QR code to install the App and get 2 free unlocks Unlock quizzes for free by uploading documents![]()
![]()
![]()
![]()

