A sample of 200 high school students were asked how many hours per week they spend watching television.The following frequency distribution presents the results.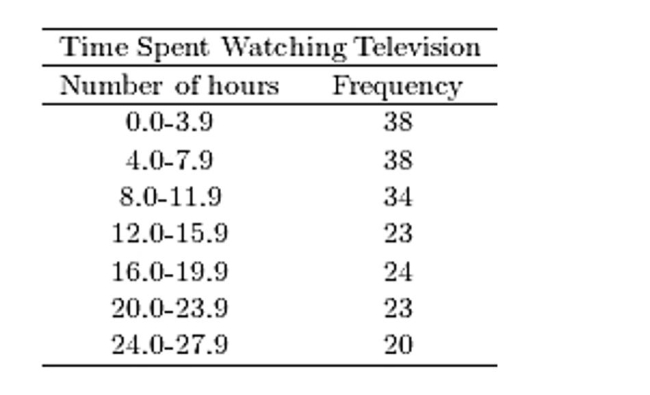 Construct a frequency ogive for the frequency distribution.
A) 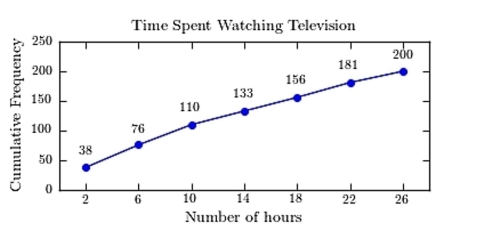
B) 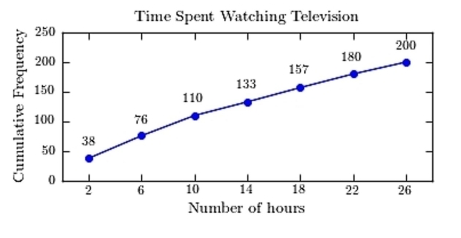
C) 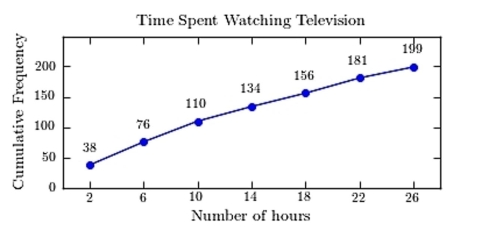
D) 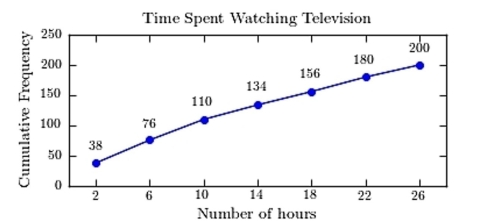
Correct Answer:
Verified
Q24: Thirty households were surveyed for the
Q25: Construct a dotplot for the following
Q26: Following are the numbers of Dean's
Q27: A sample of 200 high school students
Q28: Construct a stem-and-leaf plot for the
Q29: Thirty households were surveyed for the
Q30: A sample of 200 high school students
Q31: Construct a stem-and-leaf plot for
Q33: Which of the following presents the most
Q34: A sample of 200 high school students
Unlock this Answer For Free Now!
View this answer and more for free by performing one of the following actions

Scan the QR code to install the App and get 2 free unlocks

Unlock quizzes for free by uploading documents