The following display from a graphing calculator presents the least-squares regression line for predicting the price of a certain commodity (y) from the price of a barrel of oil(x) .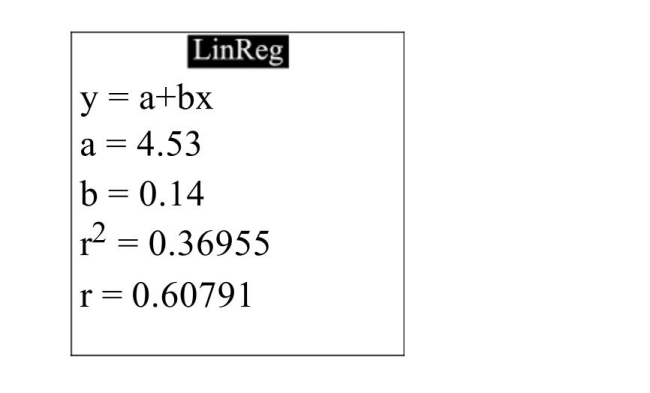 Predict the commodity price when oil costs $107 per barrel.
A) $20
B) $44
C) $485
D) $70
Correct Answer:
Verified
Q1: One of the primary feeds for
Q3: Characterize the relationship shown in the figure.
Q4: One of the primary feeds for
Q5: Compute the correlation coefficient.
Q6: The following table presents the number
Q7: Compute the least-squares regression line for
Q8: One of the primary feeds for
Q9: For which of the following scatter plots
Q10: One of the primary feeds for
Q11: The common cricket can be used
Unlock this Answer For Free Now!
View this answer and more for free by performing one of the following actions

Scan the QR code to install the App and get 2 free unlocks

Unlock quizzes for free by uploading documents