Short Answer
The graph below shows the regression line for the data. The correlation coefficient is . Is it correct to say this data show strong positive correlation? 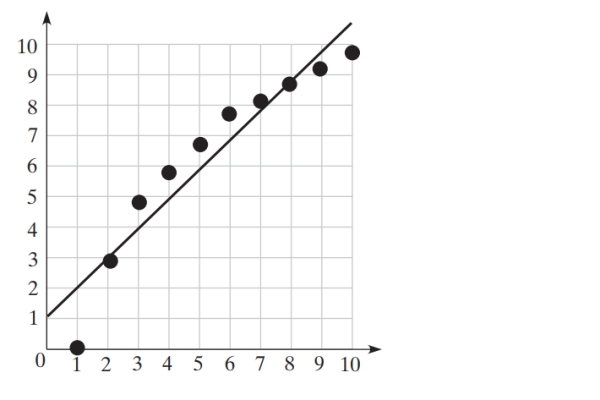
Correct Answer:
Verified
Related Questions
Q95: Find the average rate of change
Q96: Write the parametric form of the equation
Q97: A Solve the system graphically.
Round the
Q98: What is a blinded experiment?
Q99: Determine the sum, if it exists,
Q101: Use the binomial theorem to expand
Unlock this Answer For Free Now!
View this answer and more for free by performing one of the following actions

Scan the QR code to install the App and get 2 free unlocks

Unlock quizzes for free by uploading documents