The following data show the number of laps run by each participant in a marathon.
Which of these choices display the correct stemplot?
A) 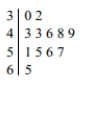
B) 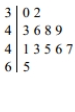
Correct Answer:
Verified
Q5: Which choice displays the best graphic
Q6: Analysis of the data from 25 mothers
Q7: The two key parts of a regression
Q8: A nurse measured the blood pressure
Q9: Identify the cumulative frequency distribution that
Q11: The weights (in pounds)of 22 members
Q12: The scatterplot below displays the amount of
Q13: Analysis of the data from 25 mothers
Q14: A nurse measured the blood pressure
Q15: The following frequency distribution analyzes the
Unlock this Answer For Free Now!
View this answer and more for free by performing one of the following actions

Scan the QR code to install the App and get 2 free unlocks

Unlock quizzes for free by uploading documents