At the same time each day, a researcher records the temperature in each of three greenhouses. The table shows the temperatures in degrees Fahrenheit recorded for one week.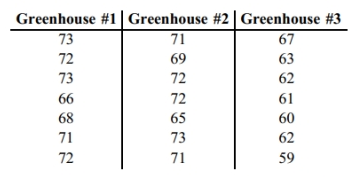
i) Use a 0.05 significance level to test the claim that the average temperature is the same in each greenhouse.
ii) How are the analysis of variance results affected if the same constant is added to every one of the original sample values?
Correct Answer:
Verified
View Answer
Unlock this answer now
Get Access to more Verified Answers free of charge
Q1: Use the data in the given
Q2: Test the claim that the samples
Q3: Explain the procedure for two-way analysis of
Q5: The following data contains task completion times,
Q6: List the assumptions for testing hypotheses that
Q7: The data below represent the weight
Q8: Draw an example of an F distribution
Q9: Suppose you are to test for
Q10: Test the claim that the samples
Q11: Use the Minitab display to test the
Unlock this Answer For Free Now!
View this answer and more for free by performing one of the following actions

Scan the QR code to install the App and get 2 free unlocks

Unlock quizzes for free by uploading documents