A machine that is supposed to fill small bottles to contain 20 milliliters yields the following data from a test of 4 bottles every hour. What would be the centerline for a control chart for ?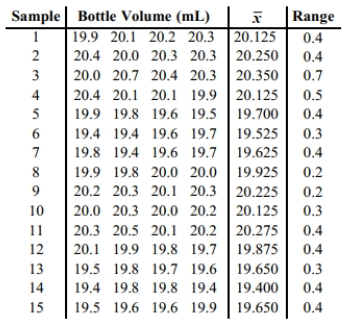
A) 0.380 milliliters
B) 19.935 milliliters
C) 20.000 milliliters
D) 20.212 milliliters
Correct Answer:
Verified
Q48: Which type of chart does not
Q49: The centerline for a control chart for
Q50: Examine the given run chart or control
Q51: Consider process data consisting of the
Q52: A machine is supposed to fill boxes
Q54: Which type of chart would be
Q55: Which of the following is not one
Q56: _ measurement of a characteristic or good
Q57: R charts are used to monitor_.
A) means
B)
Q58: Control charts are used to monitor changing
Unlock this Answer For Free Now!
View this answer and more for free by performing one of the following actions

Scan the QR code to install the App and get 2 free unlocks

Unlock quizzes for free by uploading documents