Construct an chart and determine whether the process variation is within statistical control.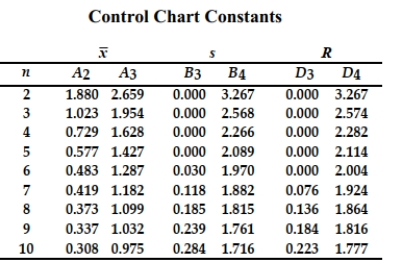
A machine that is supposed to produce ball bearings with a diameter of 7 millimeters yields the following data from a test of 5 ball bearings every 20 minutes.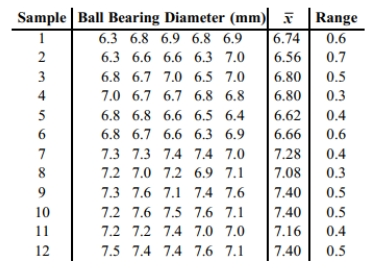
Correct Answer:
Verified
Q25: Sketch a run chart that that indicates
Q26: Match the chart with its characteristic.
Q27: A control chart for
Q28: Construct an
Q29: Use the given process data to
Q31: A control chart for
Q32: Describe a p chart and give an
Q33: Examine the given run chart or control
Q34: Construct a run chart for individual values
Q35: Use the given process data to
Unlock this Answer For Free Now!
View this answer and more for free by performing one of the following actions

Scan the QR code to install the App and get 2 free unlocks

Unlock quizzes for free by uploading documents