The graph below shows the percentage of students enrolled in the College of Engineering at State University. Use the
graph to answer the question.
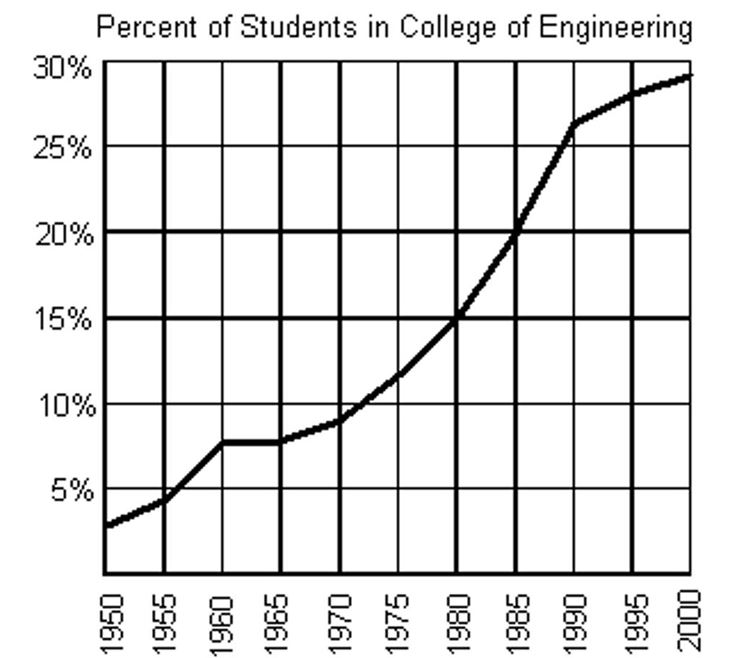
-If f(x) = 15%, what year is represented by x?
A) 1975
B) 1970
C) 1985
D) 1980
Correct Answer:
Verified
Q61: The graph below shows the percentage of
Q63: Use the graph to find the indicated
Q64: Use the graph to find the indicated
Q66: Use the graph to find the indicated
Q67: Use the graph to determine the
Q69: Use the graph to determine the
Q70: Use the graph to determine the
Q71: Identify the intercepts Q72: Identify the intercepts Q73: The graph below shows the percentage of
-![]()
-![]()
Unlock this Answer For Free Now!
View this answer and more for free by performing one of the following actions

Scan the QR code to install the App and get 2 free unlocks

Unlock quizzes for free by uploading documents