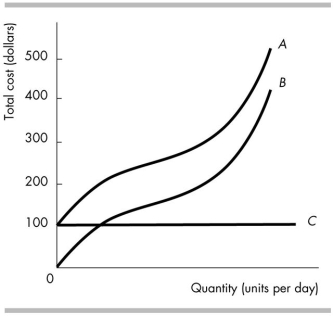
-In the above figure, the relationship between costs indicates that the distance between curves
A) A and B is equal to the variable cost.
B) B and C is equal to the fixed cost.
C) B and C is equal to the average total cost.
D) A and B is equal to the fixed cost.
Correct Answer:
Verified
Q66: After constructing a new factory, the cost
Q67: Q68: When the marginal product curve is downward- Q69: Average total costs are Q70: As output increases, total cost _ , Q72: In the short run, Q73: Q74: Diseconomies of scale definitely mean that as Q75: Among the opportunity costs of a firm Q76: Unlock this Answer For Free Now! View this answer and more for free by performing one of the following actions Scan the QR code to install the App and get 2 free unlocks Unlock quizzes for free by uploading documents![]()
A) the change in
A) at least one![]()
![]()

