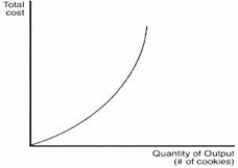
-The graph above illustrates the total cost function for GoodieCookie Co. How are the company's fixed costs represented in this graph?
A) by adding up the fixed costs
B) at any vertical axis point where the total cost curve never equals zero
C) as the point where the total cost curve touches the vertical axis
D) by adding up the variable costs
Correct Answer:
Verified
Q26: Which of the following falls outside of
Q27: Q28: The table below sets out cost information Q29: If a solar panel manufacturer wants to Q30: Q32: Mindy's company manufactures rubber balls used by Q33: Which of the following falls outside of Q34: Refer to the table below. Q35: I'MaGadgetCo. produces and sells widgets. Last year, Q36: Refer to the table below. Unlock this Answer For Free Now! View this answer and more for free by performing one of the following actions Scan the QR code to install the App and get 2 free unlocks Unlock quizzes for free by uploading documents![]()
![]()
![]()
![]()

