Figure 5-1
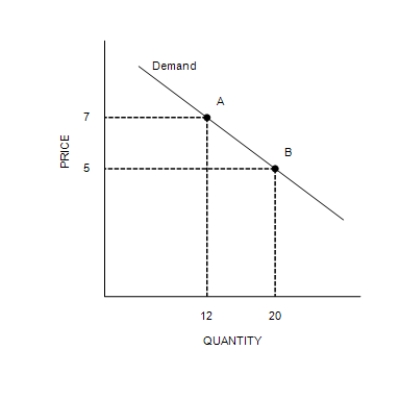
-Refer to Figure 5-1. Between point A and point B on the graph, demand is
A) perfectly elastic.
B) inelastic.
C) unit elastic.
D) elastic, but not perfectly elastic.
Correct Answer:
Verified
Q147: Using the midpoint method, the price elasticity
Q148: For a good that is a luxury,
Q149: When the price of candy bars is
Q150: Studies indicate that the price elasticity of
Q151: If the price of apples rises, when
Q153: Suppose the price of a bag of
Q154: Which of the following is likely to
Q155: A good will have a more inelastic
Q156: The demand for grape-flavored Hubba Bubba bubble
Q157: Table 5-2
Unlock this Answer For Free Now!
View this answer and more for free by performing one of the following actions

Scan the QR code to install the App and get 2 free unlocks

Unlock quizzes for free by uploading documents