Solved

Table 7-5

​ -Refer to Table 7-5

Question 132

Multiple Choice

Table 7-5


 Buyer  Willingness to Pay  (Dollars)   Charisse 450 Keira 350 Eric 300 Earvin 250\begin{array} { | c | c | } \hline \text { Buyer } & \begin{array} { c } \text { Willingness to Pay } \\\text { (Dollars) }\end{array} \\\hline \text { Charisse } & 450 \\\hline \text { Keira } & 350 \\\hline \text { Eric } & 300 \\\hline \text { Earvin } & 250 \\\hline\end{array}
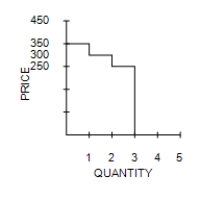
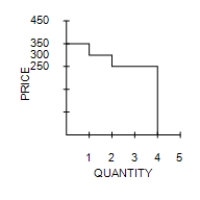
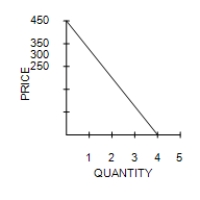
-Refer to Table 7-5. You are selling extra tickets to the Midwest Regional Sweet 16 game in the men's NCAA basketball tournament. The table shows the willingness to pay of the four potential buyers in the market for a ticket to the game. Which of the following graphs represents the market demand curve?


A) ​
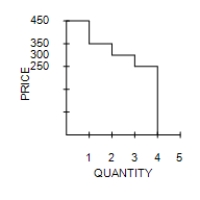
 Table 7-5 ​ ​   \begin{array} { | c | c | }  \hline \text { Buyer } & \begin{array} { c }  \text { Willingness to Pay } \\ \text { (Dollars)  } \end{array} \\ \hline \text { Charisse } & 450 \\ \hline \text { Keira } & 350 \\ \hline \text { Eric } & 300 \\ \hline \text { Earvin } & 250 \\ \hline \end{array}  -Refer to Table 7-5. You are selling extra tickets to the Midwest Regional Sweet 16 game in the men's NCAA basketball tournament. The table shows the willingness to pay of the four potential buyers in the market for a ticket to the game. Which of the following graphs represents the market demand curve? A) ​   B) ​   C) ​   D) ​
B) ​
 Table 7-5 ​ ​   \begin{array} { | c | c | }  \hline \text { Buyer } & \begin{array} { c }  \text { Willingness to Pay } \\ \text { (Dollars)  } \end{array} \\ \hline \text { Charisse } & 450 \\ \hline \text { Keira } & 350 \\ \hline \text { Eric } & 300 \\ \hline \text { Earvin } & 250 \\ \hline \end{array}  -Refer to Table 7-5. You are selling extra tickets to the Midwest Regional Sweet 16 game in the men's NCAA basketball tournament. The table shows the willingness to pay of the four potential buyers in the market for a ticket to the game. Which of the following graphs represents the market demand curve? A) ​   B) ​   C) ​   D) ​
C) ​
 Table 7-5 ​ ​   \begin{array} { | c | c | }  \hline \text { Buyer } & \begin{array} { c }  \text { Willingness to Pay } \\ \text { (Dollars)  } \end{array} \\ \hline \text { Charisse } & 450 \\ \hline \text { Keira } & 350 \\ \hline \text { Eric } & 300 \\ \hline \text { Earvin } & 250 \\ \hline \end{array}  -Refer to Table 7-5. You are selling extra tickets to the Midwest Regional Sweet 16 game in the men's NCAA basketball tournament. The table shows the willingness to pay of the four potential buyers in the market for a ticket to the game. Which of the following graphs represents the market demand curve? A) ​   B) ​   C) ​   D) ​
D) ​
 Table 7-5 ​ ​   \begin{array} { | c | c | }  \hline \text { Buyer } & \begin{array} { c }  \text { Willingness to Pay } \\ \text { (Dollars)  } \end{array} \\ \hline \text { Charisse } & 450 \\ \hline \text { Keira } & 350 \\ \hline \text { Eric } & 300 \\ \hline \text { Earvin } & 250 \\ \hline \end{array}  -Refer to Table 7-5. You are selling extra tickets to the Midwest Regional Sweet 16 game in the men's NCAA basketball tournament. The table shows the willingness to pay of the four potential buyers in the market for a ticket to the game. Which of the following graphs represents the market demand curve? A) ​   B) ​   C) ​   D) ​

Correct Answer:

verifed

Verified

Unlock this answer now
Get Access to more Verified Answers free of charge

Related Questions

Unlock this Answer For Free Now!

View this answer and more for free by performing one of the following actions

qr-code

Scan the QR code to install the App and get 2 free unlocks

upload documents

Unlock quizzes for free by uploading documents