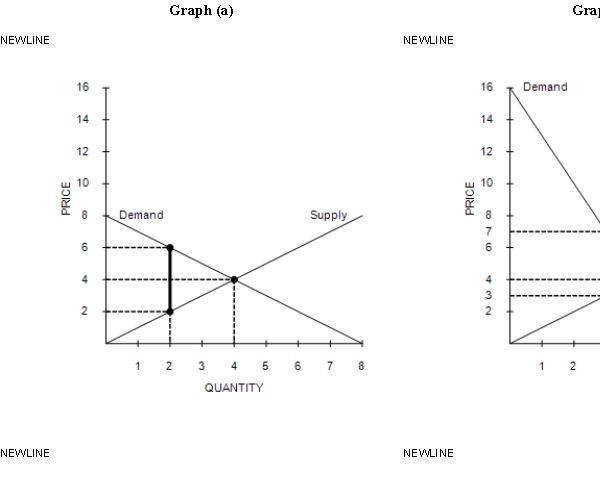
Figure 8-5

-Refer to Figure 8-5. Graph (a) and Graph (b) each illustrate a $4 tax placed on a market. In comparison to Graph (a) , Graph (b) illustrates which of the following statements?
A) When demand is relatively inelastic, the deadweight loss of a tax is smaller than when demand is relatively elastic.
B) When demand is relatively elastic, the deadweight loss of a tax is larger than when demand is relatively inelastic.
C) When supply is relatively inelastic, the deadweight loss of a tax is smaller than when supply is relatively elastic.
D) When supply is relatively elastic, the deadweight loss of a tax is larger than when supply is relatively inelastic.
Correct Answer:
Verified
Q182: Table 8-1 Q183: The deadweight loss from a tax per Q184: Taxes on labor taxes may distort labor Q185: The Social Security tax is a tax Q186: If the tax on a good is Q188: The less freedom young mothers have to Q189: Figure 8-7 Q190: Suppose the government imposes a tax on Q191: Figure 8-6 Q192: Concerning the labor market and taxes on
The vertical distance between points A![]()
Unlock this Answer For Free Now!
View this answer and more for free by performing one of the following actions

Scan the QR code to install the App and get 2 free unlocks

Unlock quizzes for free by uploading documents