Figure 8-2
The vertical distance between points C and D represents a tax in the market.
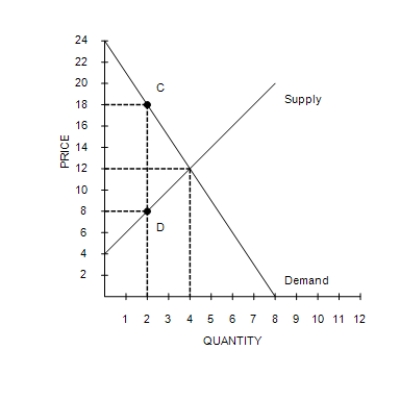
-Refer to Figure 8-2. The loss of consumer surplus associated with some buyers dropping out of the market as a result of the tax is
A) $4.
B) $6.
C) $12.
D) $8.
Correct Answer:
Verified
Q136: In the market for doodads, the supply
Q137: Figure 8-1 Q138: For widgets, the supply curve is the Q139: The government's benefit from a tax can Q140: Figure 8-1 Q142: Figure 8-1 Q143: Figure 8-2 Q144: Figure 8-2 Q145: Figure 8-2 Q146: Figure 8-1 Unlock this Answer For Free Now! View this answer and more for free by performing one of the following actions Scan the QR code to install the App and get 2 free unlocks Unlock quizzes for free by uploading documents![]()
![]()
![]()
The vertical distance between points C
The vertical distance between points C
The vertical distance between points C![]()

