Figure 10-4
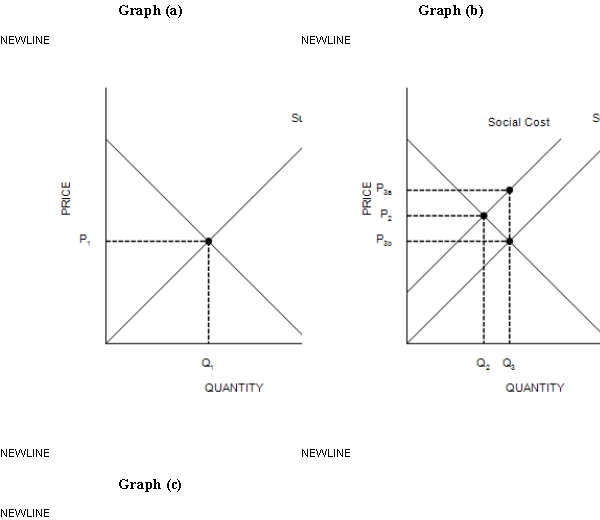
-Refer to Figure 10-4, Graph (b) and Graph (c) . The installation of a scrubber in a smokestack reduces the emission of harmful chemicals from the smokestack. Therefore, the socially optimal quantity of smokestack scrubbers is represented by point
A) Q2.
B) Q3.
C) Q4.
D) Q5.
Correct Answer:
Verified
Q138: Figure 10-2 Q139: Figure 10-3 Q140: Figure 10-1 Q141: Suppose that cookie producers create a positive Q142: Which of the following is an example Q144: Which of the following is NOT a Q145: Figure 10-3 Q146: A benevolent social planner would prefer that Q147: Table 10-2 Q148: Figure 10-4 Unlock this Answer For Free Now! View this answer and more for free by performing one of the following actions Scan the QR code to install the App and get 2 free unlocks Unlock quizzes for free by uploading documents![]()
![]()
![]()
![]()
![]()

