Figure 16-1
Graph (a) 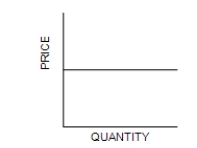
Graph (b) 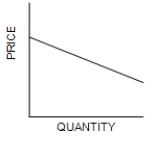
Graph (c) 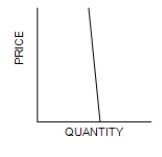
-Refer to Figure 16-1. Which of the graphs illustrates the demand curve most likely faced by a firm in a monopolistically competitive market?
A) Graph (a)
B) Graph (b)
C) Graph (c)
D) Graph (d)
Correct Answer:
Verified
Q170: Which of the following is not a
Q171: Figure 16-2
This figure depicts a situation in
Q172: When a profit-maximizing firm in a monopolistically
Q173: In the short run, a firm operating
Q174: Table 16-2
A monopolistically competitive firm has
Q176: A monopolistically competitive firm is currently producing
Q177: For a monopolistically competitive firm,
A)marginal revenue and
Q178: Table 16-3
A monopolistically competitive firm has
Q179: Which of the following conditions is characteristic
Q180: In the short run, a firm in
Unlock this Answer For Free Now!
View this answer and more for free by performing one of the following actions

Scan the QR code to install the App and get 2 free unlocks

Unlock quizzes for free by uploading documents