Figure 21-13 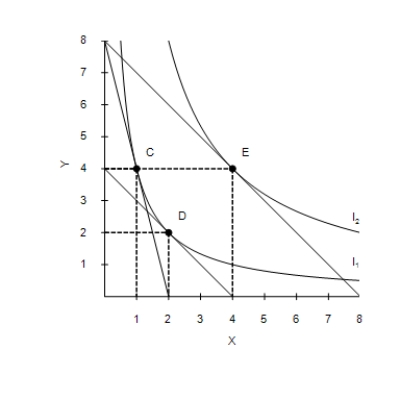
-Refer to Figure 21-13. When the price of X is $40, the price of Y is $10, and the consumer's income is $80, the consumer's optimal choice is C. Then the price of X decreases to $10. We can derive the demand curve by determining the change in the quantity demanded illustrated by the movement from
A) C to E.
B) C to D.
C) D to E.
D) E to C.
Correct Answer:
Verified
Q183: Scenario 21-2
Aliyah has recently graduated from college
Q184: Ryan experiences an increase in her wages.
Q185: Figure 21-14 Q186: Consider the indifference curve map and budget Q187: When Joshua's income increases, he purchases more Q189: Scenario 21-2 Q190: If a good is a Giffen good, Q191: The labor supply curve may have a Q192: Figure 21-13 Q193: Assume that a college student purchases only![]()
Aliyah has recently graduated from college![]()
Unlock this Answer For Free Now!
View this answer and more for free by performing one of the following actions

Scan the QR code to install the App and get 2 free unlocks

Unlock quizzes for free by uploading documents