Figure 21-2
In each case, the budget constraint moves from BC1 to BC2.
Graph (a)
Graph (b)
Graph (c)
Graph (d) 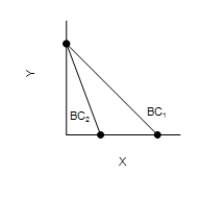
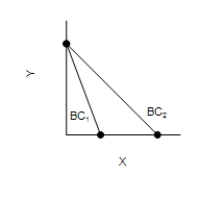
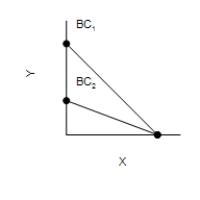
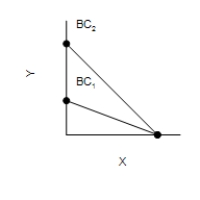
-Refer to Figure 21-2. Which of the graphs in the figure could reflect a simultaneous decrease in the prices of both goods?
A) Only graph (a)
B) Only graph (d)
C) Graph (b) or graph (c)
D) None of the graphs in the figure can reflect this.
Correct Answer:
Verified
Q115: Explain the difference between inferior and normal
Q116: For Antonio, the income effect of an
Q117: Graphically demonstrate the conditions associated with a
Q118: For Brent, the income effect of a
Q119: When a consumer spends less time enjoying
Q121: A family on a trip budgets $800
Q122: A budget constraint illustrates the
A)prices that a
Q123: Kendra, Tara, and Chelsea each buy ice
Q124: Figure 21-6 Q125: Figure 21-6 ![]()
![]()
Unlock this Answer For Free Now!
View this answer and more for free by performing one of the following actions

Scan the QR code to install the App and get 2 free unlocks

Unlock quizzes for free by uploading documents