Figure 21-17
The graph shows two budget constraints for a consumer.
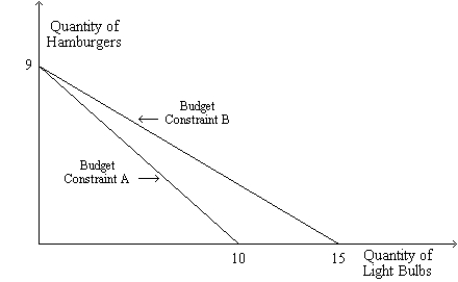
-Refer to Figure 21-17. Suppose the price of a light bulb is $3 and Budget Constraint B applies. What is the consumer's income? What is the price of a hamburger?
Correct Answer:
Verified
View Answer
Unlock this answer now
Get Access to more Verified Answers free of charge
Q54: A rise in the interest rate will
Q55: Figure 21-17
The graph shows two budget constraints
Q56: A worker with a backward-bending labor supply
Q57: A consumer maximizes utility at a point
Q58: A rise in the interest rate will
Q60: Shelley wins $1 million in her state's
Q61: What does the slope of a consumer's
Q62: Figure 21-18
The figure shows two indifference curves
Q63: A consumer's budget constraint is drawn on
Q64: Teresa faces prices of $6.00 for a
Unlock this Answer For Free Now!
View this answer and more for free by performing one of the following actions

Scan the QR code to install the App and get 2 free unlocks

Unlock quizzes for free by uploading documents