Figure 27-3
The following figure shows a utility function for Dexter. 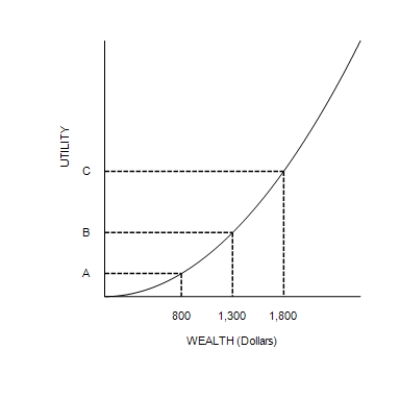
-Refer to Figure 27-3. Suppose the vertical distance between the points (0, A) and (0, B) is 12. If his wealth increased from $1,300 to $1,800, then
A) Dexter's subjective measure of his well-being would increase by less than 12 units.
B) Dexter's subjective measure of his well-being would increase by more than 12 units.
C) Dexter would change from being a risk-averse person into a person who is not risk averse.
D) Dexter would be more likely to buy insurance.
Correct Answer:
Verified
Q175: Figure 27-4 Q176: Which of the following actions best illustrates Q177: Figure 27-3 Q178: Russell holds stocks in four companies. If Q179: Rory has purchased a product from an Q181: Which of the following is not consistent Q182: Consider the following two situations. Irene accepts Q183: Fundamental analysis shows that Johnson's Lumber Corporation's Q184: Fundamental analysis shows that Quadrangle Company is Q185: Which of the following methods of picking![]()
The following figure shows a utility
Unlock this Answer For Free Now!
View this answer and more for free by performing one of the following actions

Scan the QR code to install the App and get 2 free unlocks

Unlock quizzes for free by uploading documents