Figure 27-1
The following figure shows a utility function for Ren. 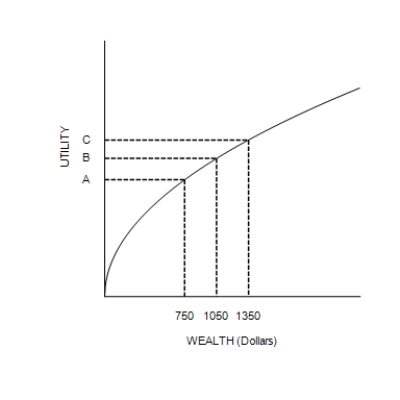
-Refer to Figure 27-1. Suppose the vertical distance between the points (0, A) and (0, B) is 9. If his wealth increased from $1,050 to $1,350, then
A) Ren's subjective measure of his well-being would increase by less than 9 units.
B) Ren's subjective measure of his well-being would increase by more than 9 units.
C) Ren would change from being a risk-averse person into a person who is not risk averse.
D) Ren would change from being a person who is not risk averse into a risk-averse person.
Correct Answer:
Verified
Q144: Figure 27-1
The following figure shows a utility
Q145: A University of Iowa basketball standout is
Q146: Suppose you win a small lottery and
Q147: Happy Trails, a bicycle rental company, is
Q148: Mixster Concrete Company is considering buying a
Q150: In answering which of the following questions
Q151: Figure 27-1
The following figure shows a utility
Q152: Xavier puts $7,000 into each of two
Q153: For a risk averse person,
A)the pleasure of
Q154: According to the rule of 70, if
Unlock this Answer For Free Now!
View this answer and more for free by performing one of the following actions

Scan the QR code to install the App and get 2 free unlocks

Unlock quizzes for free by uploading documents