The figure below shows the production possibilities curve for the island of Genovia: 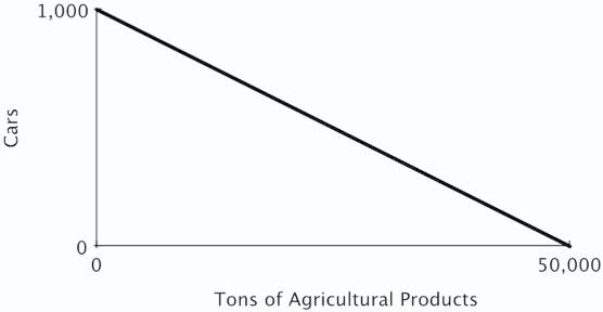 The opportunity cost of producing a car in Genovia is:
A) 5,000 tons of agricultural products.
B) 500 tons of agricultural products.
C) 5 tons of agricultural products.
D) 50 tons of agricultural products.
Correct Answer:
Verified
Q37: Dent 'n' Scratch Used Cars and Trucks
Q38: Dent 'n' Scratch Used Cars and Trucks
Q39: Dent 'n' Scratch Used Cars and Trucks
Q40: Refer to the table below.According to the
Q43: The figure below shows Becky's daily production
Q45: The figure below shows the production possibilities
Q47: Refer to the figure below.If Pat and
Q60: A graph that illustrates the maximum amount
Q80: The downward slope of the production possibilities
Q97: Consider a graph of a production possibilities
Unlock this Answer For Free Now!
View this answer and more for free by performing one of the following actions

Scan the QR code to install the App and get 2 free unlocks

Unlock quizzes for free by uploading documents