Professor wants to identify the relationship between the test scores in her class and the number of hours spent by student preparing to the test. She collected information about preparing time and the test scores in the table below. 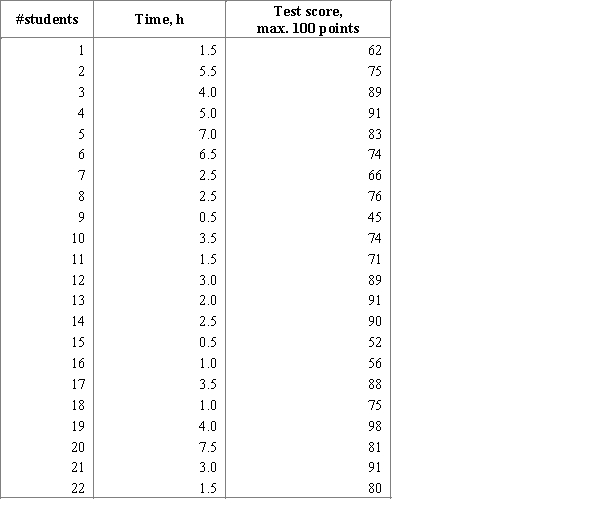 Choose the most appropriate graphical display for professor to see the relationship between preparing time and the test scores.
A) Bar Chart
B) Comparative Bar Chart
C) Time Series Plot
D) Scatterplot
E) Histogram
Correct Answer:
Verified
Q52: One of the "media messages" sent by
Q53: In 1986 marine biologists reported the discovery
Q54: In recent years there has been a
Q55: Iowa is an agricultural state with a
Q56: Each person in a sample of 800
Q57: A statistics company made a survey about
Q58: Iowa is an agricultural state with a
Q59: Records of the missions of Baja California
Q60: Investigators writing in the Journal of Early
Q62: According to the data from fec.gov, since
Unlock this Answer For Free Now!
View this answer and more for free by performing one of the following actions

Scan the QR code to install the App and get 2 free unlocks

Unlock quizzes for free by uploading documents