The pie chart below summarizes the results of a survey of 300 randomly selected students at a particular high school. The investigators asked about soft drink preferences at a local high school. 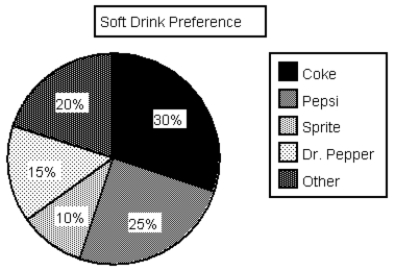 (a)How many out of the 300 students indicated a preference for Dr. Pepper?
(b)Write a few sentences summarizing the soft drink preference for this sample of students.
(c)Using the information in the pie chart above, sketch a relative frequency bar chart for these data.
Correct Answer:
Verified
View Answer
Unlock this answer now
Get Access to more Verified Answers free of charge
Q43: Investigators studying the relation between gender and
Q44: As part of the United States Census,
Q45: Exhibit 2-3
There has been a recent increase
Q46: Exhibit 2-3
There has been a recent increase
Q47: In a story written in December 2002,
Q49: Exhibit 2-4
In the article, "Scaling of Mammalian
Q50: In birds, the muscles that pull the
Q51: In the article, "Dimensional Relationships for Flying
Q52: One of the "media messages" sent by
Q53: In 1986 marine biologists reported the discovery
Unlock this Answer For Free Now!
View this answer and more for free by performing one of the following actions

Scan the QR code to install the App and get 2 free unlocks

Unlock quizzes for free by uploading documents