A statewide survey released by the University of Iowa Injury Prevention Research Center was designed to assess compliance with Iowa seatbelt law. The table below shows the results for 5 Iowa cities. 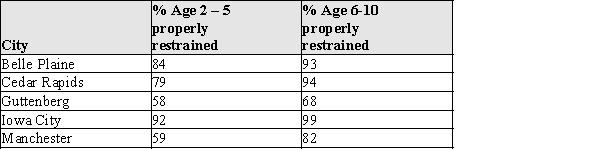
(a)Display these data in a comparative bar chart so that the different ages can be compared for the different cities.
(b)Write a brief description of the differences and similarities in the patterns you observe in your bar chart for part (a).
Correct Answer:
Verified
View Answer
Unlock this answer now
Get Access to more Verified Answers free of charge
Q6: Frequency distributions can only be used with
Q8: The relative frequency for a particular category
Q9: An outlier is an unusually small or
Q16: The quantity Q20: The density of a class can be Q22: The frequency distribution shown summarizes data on Q23: Bat characteristics Q24: The annual household incomes, in thousands of Q25: The annual household incomes, in thousands of Q26: Ruminants are hoofed animals such as cattle![]()
Biologists know that bats have different
Unlock this Answer For Free Now!
View this answer and more for free by performing one of the following actions

Scan the QR code to install the App and get 2 free unlocks

Unlock quizzes for free by uploading documents