The cumulative relative frequency plot shown was constructed using data on the percentage of college students enrolled in public institutions for the 50 U.S. states. Which of the following is closest to the approximate proportion of states that have more than 90 percent of college students enrolled in public institutions? 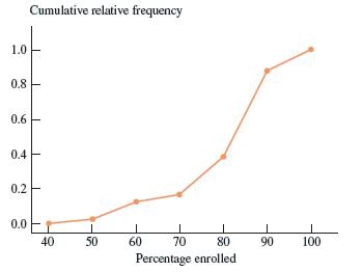
A) 0.6
B) 0.1
C) 0.0
D) 0.4
E) 0.9
Correct Answer:
Verified
Q22: The frequency distribution shown summarizes data on
Q23: Bat characteristics
Biologists know that bats have different
Q24: The annual household incomes, in thousands of
Q25: The annual household incomes, in thousands of
Q26: Ruminants are hoofed animals such as cattle
Q28: Exhibit 2-4
In the article, "Scaling of Mammalian
Q29: The most important right and responsibility of
Q30: Artificial nest have often been used when
Q31: Exhibit 2-2
In a story written in December
Q32: Biologists know that bats have different flight
Unlock this Answer For Free Now!
View this answer and more for free by performing one of the following actions

Scan the QR code to install the App and get 2 free unlocks

Unlock quizzes for free by uploading documents