Exhibit 3-1
In recent years there has been considerable discussion about the appropriateness of the body shapes and proportions of Ken and Barbie dolls. These dolls are very popular, and there is some concern that the dolls may be viewed as having the "ideal body shape," potentially leading young children to risk anorexia in pursuit of that ideal. Researchers investigating the dolls' body shapes scaled Ken and Barbie up to a common height of 170.18 cm (5' 7") and compared them to body measurements of active adults. Common measures of body shape are the chest (bust), waist, and hip circumferences. These measurements for Ken and Barbie and their reference groups are presented in the table below: 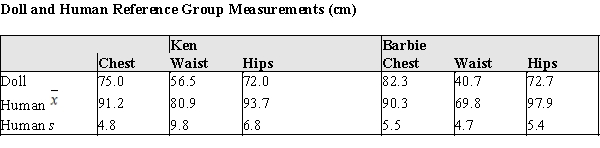 For the following questions, suppose that the researchers' scaled up dolls suddenly found themselves in the human world of actual men and women.
-Refer to Exhibit 3-1.
(a)Convert Barbie's chest, waist, and hips measurements to z-scores. Which of those measures appears to be the most different from Barbie's reference group? Justify your response with an appropriate statistical argument.
(b)The z-scores for Ken's Chest, Waist, and Hips when compared to active male adults are approximately −3.4, −2.5, and −3.2 respectively. Do these z-scores provide evidence to justify the claim that the Ken doll is a thin representation of adult men? Justify your response
(c)If women's waist measurements are approximately normally distributed, based on the sample above what is the approximate percentile of an 80 cm waist?
Correct Answer:
Verified
waist: z = −6.19
hips...
View Answer
Unlock this answer now
Get Access to more Verified Answers free of charge
Q23: Which statistical parameters of the numerical data
Q24: Astronomers are interested in the recessional velocity
Q25: The Territory of Iowa was initially surveyed
Q26: The % by weight of the element
Q27: The National U.S. Bureau of Labor Statistics
Q29: The Territory of Iowa was initially surveyed
Q30: The data in the table below are
Q31: Exhibit 3-1
In recent years there has been
Q32: The data in the table below are
Q33: To compare the average weekly earnings of
Unlock this Answer For Free Now!
View this answer and more for free by performing one of the following actions

Scan the QR code to install the App and get 2 free unlocks

Unlock quizzes for free by uploading documents