The table below summarizes the number of minutes spent exercising each day for a sample of 30 female college students. 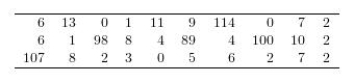 Construct a graphical display of the data distribution and then indicate what summary measures you would use to describe center and spread.
A) center = mean; spread = standard deviation
B) center = mean; spread = interquartile range
C) center = median; spread = standard deviation
D) center = median; spread = interquartile range
E) center = mode; spread = range
Correct Answer:
Verified
Q1: For any given data set, the median
Q8: Costs per serving (in cents) for 16
Q9: Exhibit 3-2
In 1990 the New York
Q10: The interquartile range is resistant to the
Q10: The dot plot below shows the annual
Q12: A common topic of study among biologists
Q12: If there are no outliers, a skeletal
Q14: Suppose that the distribution of weekly water
Q15: The mean number of text messages sent
Q17: Which of the five boxplots shown in
Unlock this Answer For Free Now!
View this answer and more for free by performing one of the following actions

Scan the QR code to install the App and get 2 free unlocks

Unlock quizzes for free by uploading documents