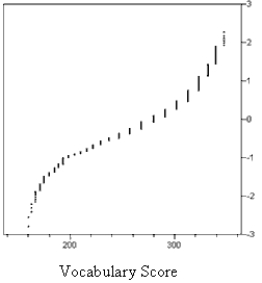
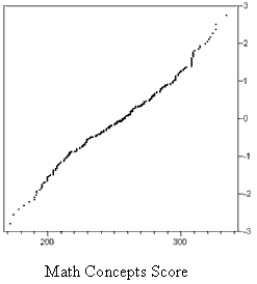
The graphs below are normal probability plots of the vocabulary and math concept scores on a standardized exam for a large sample of students. One of the score distributions is approximately normal. Identify the score distribution that is approximately normal and explain the reason for your choice.
Correct Answer:
Verified
View Answer
Unlock this answer now
Get Access to more Verified Answers free of charge
Q21: Briefly describe how the correlation coefficient can
Q25: Briefly describe how one would decide which
Q36: The time that it takes a randomly
Q45: In a study of the reaction times
Q63: Seventy-five percent of the computers sold by
Q64: Suppose that in a certain metropolitan area
Q65: Suppose that the random variable 
Q66: Ron rolls a six-sided dice until the
Q70: Suppose that 73% of the visitors to
Q72: Suppose that call-center receives on average 1.7
Unlock this Answer For Free Now!
View this answer and more for free by performing one of the following actions

Scan the QR code to install the App and get 2 free unlocks

Unlock quizzes for free by uploading documents