Three different statistics are being considered for estimating a population characteristic. The sampling distributions of the three statistics are shown in the following illustration: 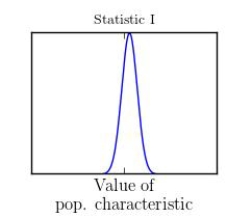
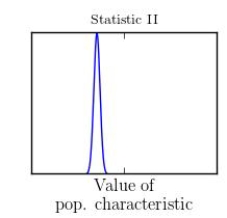
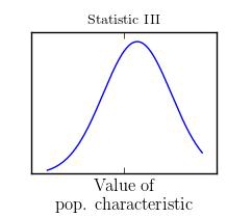 Which statistic would you recommend?
A) Statistic I
B) Statistic II
C) Statistic III
D) Statistic I or Statistic II
E) Statistic II or Statistic III
Correct Answer:
Verified
Q3: The standard error of Q4: The sampling distribution of p tends to Q6: A 90% confidence interval for a population Q7: What proportion of college students have used Q9: Chuck has decided to increase the size Q10: An unbiased statistic is one that Q11: Using an unbiased statistic guarantees that there Q11: A random sample will be selected from Q13: Jasmine has decided to decrease the confidence Q18: What is the difference between an unbiased![]()
A)is
Unlock this Answer For Free Now!
View this answer and more for free by performing one of the following actions

Scan the QR code to install the App and get 2 free unlocks

Unlock quizzes for free by uploading documents