Use this comparative bar chart to find the month which had the lowest total number of outages during both years. 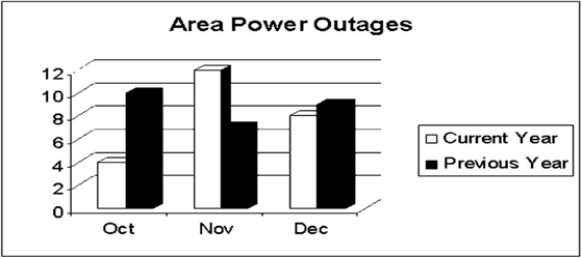
A) October
B) November
C) December
Correct Answer:
Verified
Q6: The median of a set of numbers
Q7: Compute the arithmetic mean of the following
Q8: Use this pie chart to determine the
Q9: _ are a collection of related data
Q10: Use this component bar chart to find
Q12: Given this multiple line chart, find the
Q13: What were the total sales of
Q14: Given this multiple line chart, find the
Q15: A(n) _ is a special type of
Q16: _ represent quantities or percentages by the
Unlock this Answer For Free Now!
View this answer and more for free by performing one of the following actions

Scan the QR code to install the App and get 2 free unlocks

Unlock quizzes for free by uploading documents